
Dashboard
What The Dashboard Is For
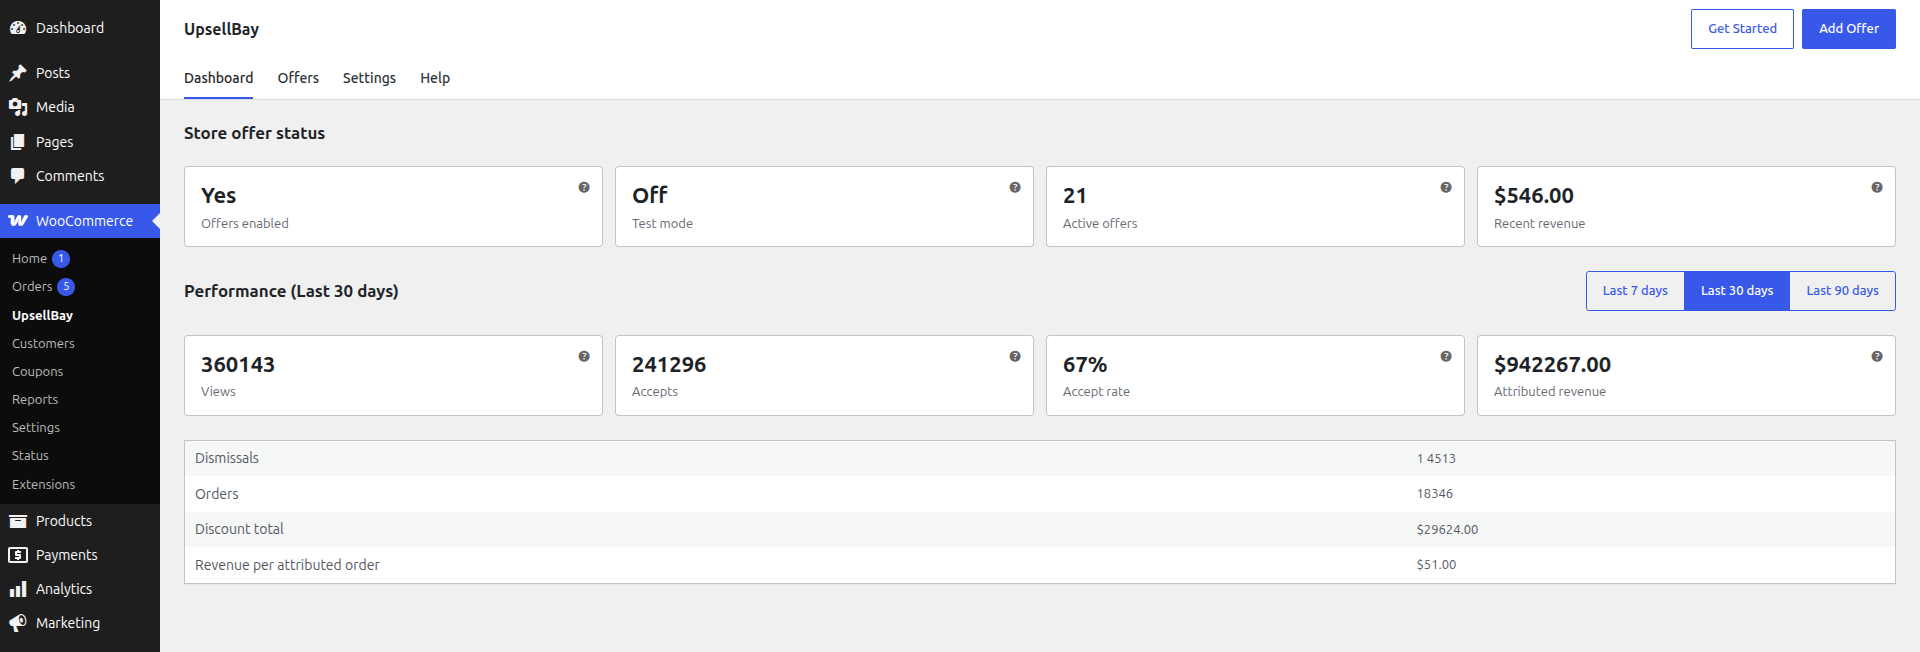
Section titled “What The Dashboard Is For”The Dashboard is the quickest place to answer three operational questions:
- Are offers globally enabled?
- Are there any active offers?
- Has UpsellBay generated views, accepts, and attributed revenue recently?
If no active offers exist yet, the dashboard shows an onboarding panel with a Create your first offer button that opens the offer editor.
Where The Numbers Come From
Section titled “Where The Numbers Come From”The free plugin’s dashboard shows running totals of views, accepts, and dismissals, which it keeps as counters on each offer. These are the same counters shown in the Offers list.
UpsellBay Pro adds the date-range performance section described below. It reads Pro’s own daily stats table, which is a separate store from the per-offer counters. Pro passes its product page, cart, and thank-you events on to the free plugin so the counters include them, and records checkout bump events in its table. Each event goes to each store once. The two stores are not reconciled with each other, so their totals can still differ.
Store Offer Status Cards
Section titled “Store Offer Status Cards”The top metric cards summarize current store state:
- Offers enabled: whether UpsellBay is globally allowed to render live offers
- Test mode: whether previews are currently limited to store managers/admins
- Active offers: how many offers are currently set to
Active - Recent revenue: recently attributed revenue from aggregate stats
Performance Range Controls
Section titled “Performance Range Controls”The dashboard supports three aggregate date windows:
Last 7 daysLast 30 daysLast 90 days
Performance Metrics
Section titled “Performance Metrics”How many offer render events were recorded for the selected date range.
Accepts
Section titled “Accepts”How many times shoppers accepted an offer.
Accept Rate
Section titled “Accept Rate”Accepts divided by views for the selected window.
Attributed Revenue
Section titled “Attributed Revenue”Revenue that UpsellBay attributes to accepted offers in the aggregate stats table.
Dismissals
Section titled “Dismissals”How many offers were explicitly dismissed.
Orders
Section titled “Orders”How many orders are included in the attributed analytics summary for the selected window.
Discount Total
Section titled “Discount Total”The total discount amount associated with accepted offers in that period.
Revenue Per Attributed Order
Section titled “Revenue Per Attributed Order”Displayed in the UI as the per-order revenue lift across attributed orders.