

Dashboard Analytics
The NotifyBay Dashboard transforms thousands of individual customer requests into a high-level strategic overview of your store’s performance. It helps you stop guessing what to order or when to run a sale by showing you exactly what your customers want right now.
To access your analytics, navigate to NotifyBay > Dashboard in your WordPress admin.
1. Top Metric Cards
Section titled “1. Top Metric Cards”The four cards at the top of your dashboard provide an instant snapshot of your revenue opportunities and historical success.
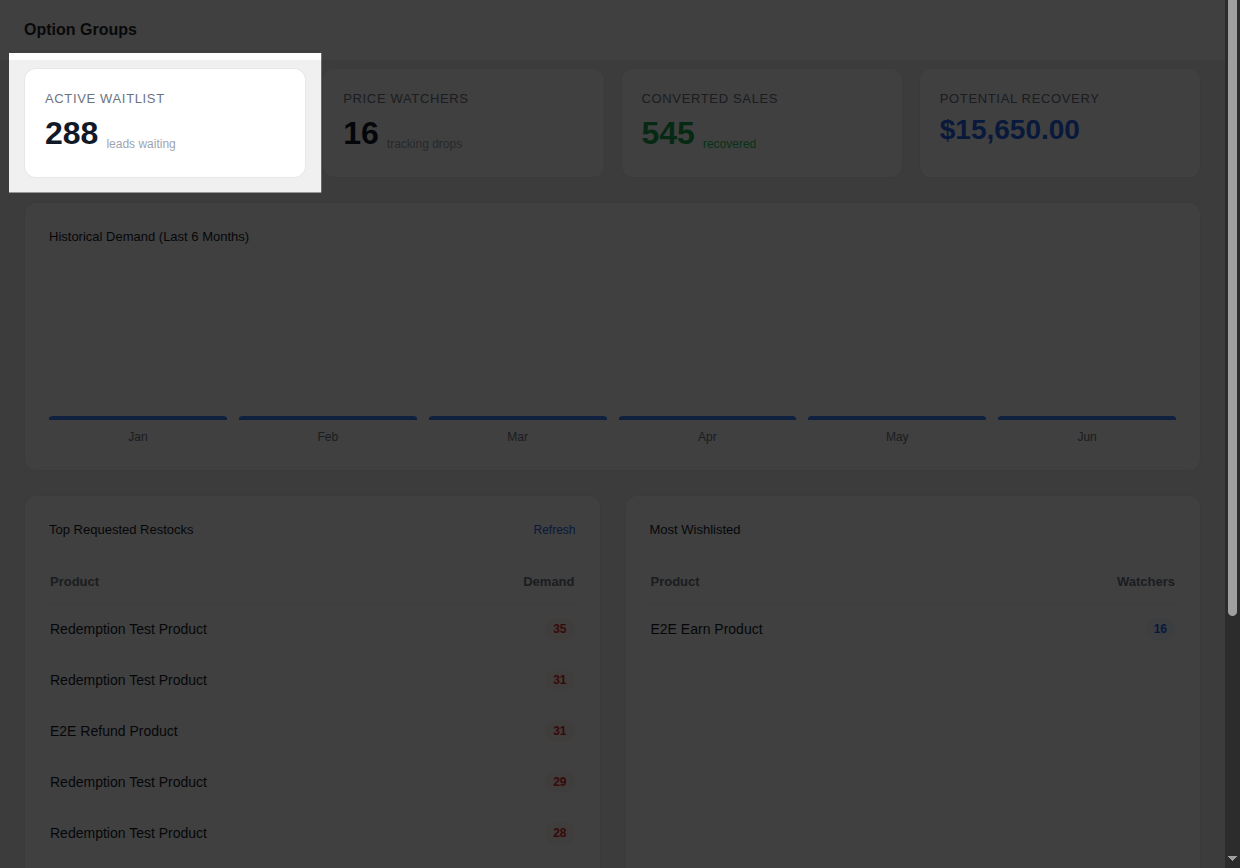
Active Waitlist
Section titled “Active Waitlist”This is the total number of unique shoppers currently waiting for out-of-stock items.
- The Goal: Keep this number low by restocking high-demand items quickly.
- Merchant Tip: A rising Active Waitlist during a marketing campaign indicates you are out-performing your inventory—it’s a signal to increase your next purchase order.
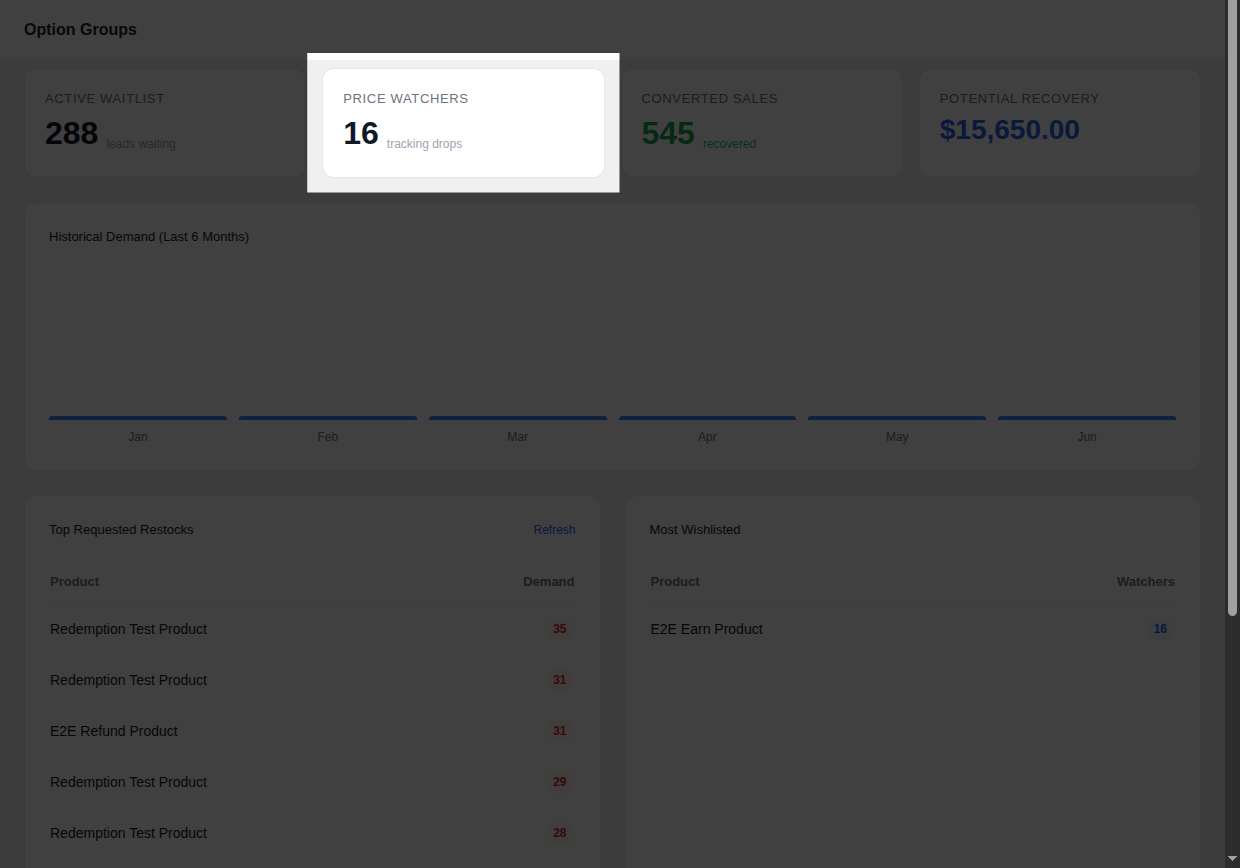
Price Watchers
Section titled “Price Watchers”The total count of customers who have set a “Target Price” for in-stock items but haven’t purchased yet.
- The Goal: Convert these “browsers” into “buyers” by hitting their target price.
- Merchant Tip: High numbers here mean your products are desired, but the current price is a barrier. Consider a temporary sale to clear this queue.
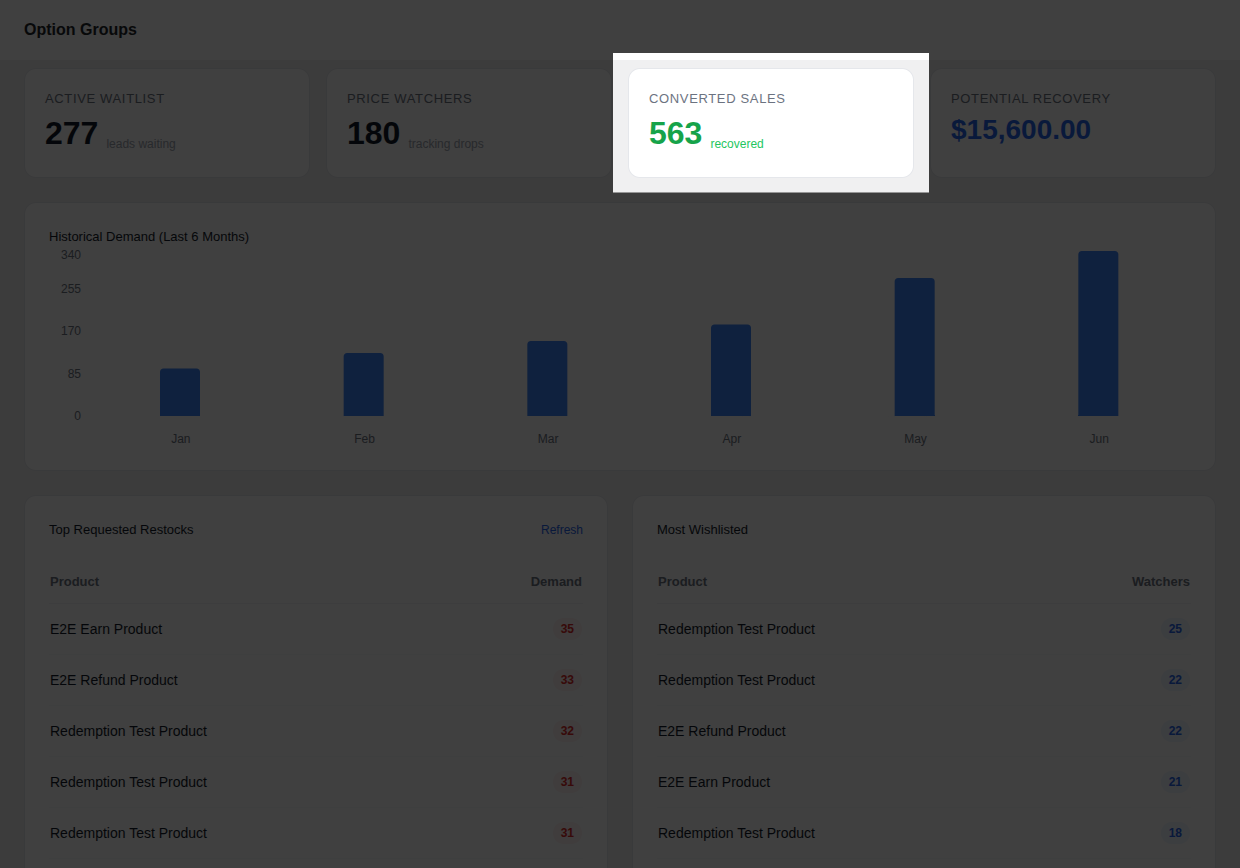
Converted Sales
Section titled “Converted Sales”Your primary ROI Metric. This tracks the total number of sales generated directly from a NotifyBay email link.
- The Goal: Watch this number grow to prove the monetary value the plugin adds to your store.
- How it works: A sale is counted if a customer clicks an automated restock or price drop email and completes their purchase within your defined Conversion Window.
Potential Recovery
Section titled “Potential Recovery”The estimated market value of your current waitlist.
- Calculation: It multiplies the number of active waitlist leads by the current price of those items.
- The Goal: This is the “Money on the Table.” Use this figure to justify inventory budgets to your team or bank.

2. Historical Demand Trends
Section titled “2. Historical Demand Trends”This interactive chart displays your lead generation volume over the last 6 months.
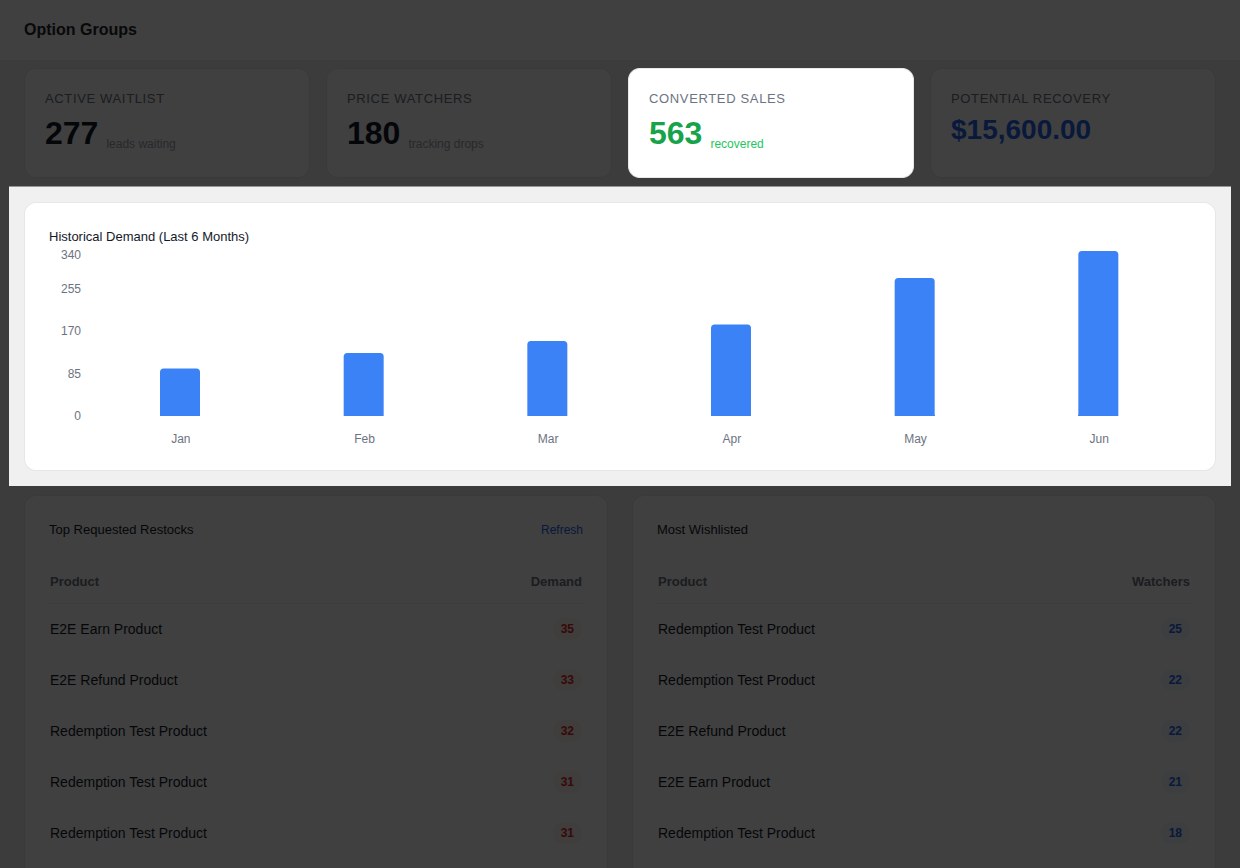
- Seasonality: Identify which months your customers are most active in requesting items.
- Campaign Impact: Correlate spikes in the chart with your social media ads or influencer shoutouts. If an ad drives 500 people to a waitlist, you know that campaign was a success even if you were out of stock.
3. High-Priority Action Tables
Section titled “3. High-Priority Action Tables”Located at the bottom of the dashboard, these tables tell you exactly which products to restock first.
Top Requested Restocks
Section titled “Top Requested Restocks”Ranks your out-of-stock products by the number of active subscribers waiting for them.
- Action: Restock the product at the top of this list first—it represents your fastest guaranteed revenue.
Most Wishlisted
Section titled “Most Wishlisted”Ranks your in-stock products by the number of price watchers.
- Action: If a product has high watchers, it’s a prime candidate for your next flash sale or email promotion.
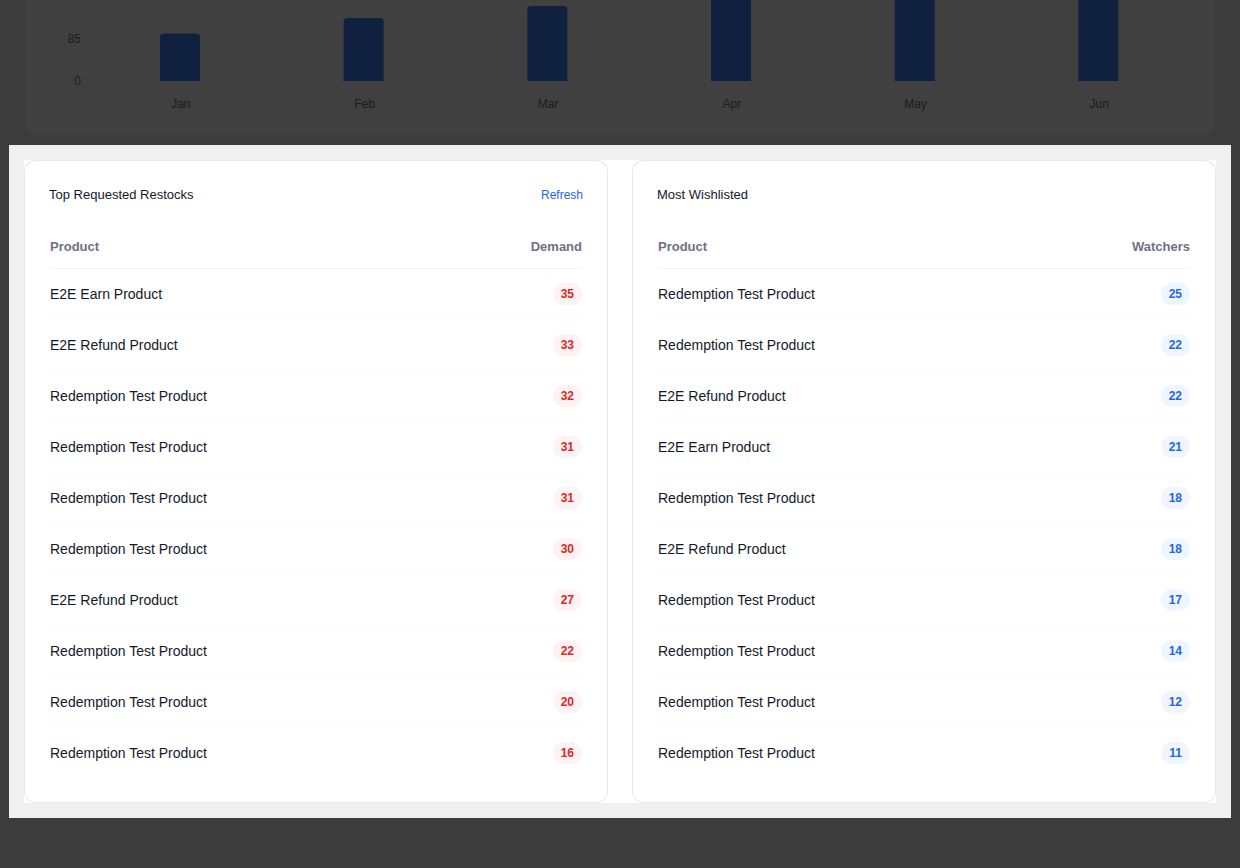
[!TIP] Use the Refresh button at the top of the action tables to ensure you are seeing the most recent data if you have been restocking items in a separate browser tab.